


Exciting news. The extensive range of new features on Dataloft by PriceHubble is now live. Subscribers continue to benefit from the things they love but have even more hyper-local content, even quicker outputs, and yet more high-quality datasets brought to life on their behalf.
We’ve evolved over time to offer hyper-relevant content
Since launch, the primary reasons for creating our market insight platform have not changed. However, they have increased in importance.
The fundamental problem we set out to solve was how to help subscribers quickly understand and share local property market analysis with customers. Our subscribers are now dealing with even more informed customers, used to having information at their fingertips. We have continually added to our sales, lettings and other datasets to cater for this.
The second key problem we set out to solve was how to arm property professionals with enough of the right kind of marketing content. In the last few years, digital marketing has catapulted forward in importance. We have responded by increasing the content available, with enough outputs to cover the digital marketing spectrum.
We are now all visual learners, glancing at information, rather than consuming the detail. As a result, we continue to be more than just a data provider. We don’t just analyse sales and lettings data but interpret and present it in a way that wins new business. Curated and packaged by experts, the content is highly visual and creative.
So, what’s new?
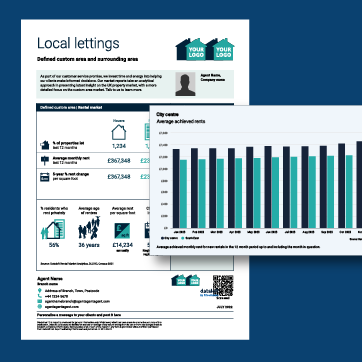
More lettings insight
Our rental dataset, the UK’s most comprehensive single source of achieved rents, has now been extended to include over 6 million records and around 40,000 new lines of data every month. The data covers England, Wales and Scotland and takes our overall coverage to 40% of the UK rental market.
There are a number of new charts and commentary. Subscribers can access and share information for their local markets like average rents over time, gross yields by property type and bedroom, analysis of the prime market and rents per square foot. Key rental market indices are also added, as well as a new table showing HM Treasury forecasts for economic indicators.
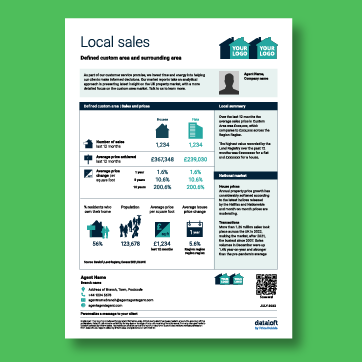
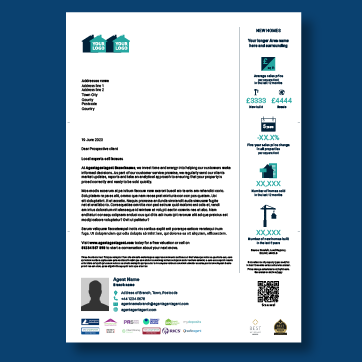
More branded content outputs
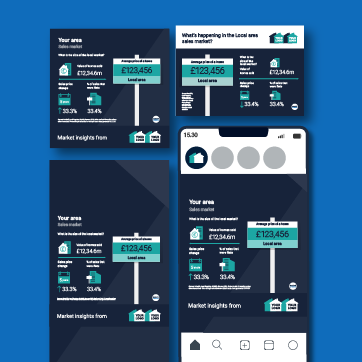
The outputs for our sales, local demographics and new homes data have also been expanded and updated. Our range of eight market reports have all been given a re-design. We have added to our very popular flyers and letters, with new formats and 10 flyers now available. Infographics are now available in a variety of formats for social. A slicker API, with even more data outputs aids digital marketing automations and integrations.
An even easier user experience
There is also a cleaner layout, improved user journey and quicker processing. Additional signposting will point users to other parts of the site to highlight key charts and features and new content will be shown on the homepage.
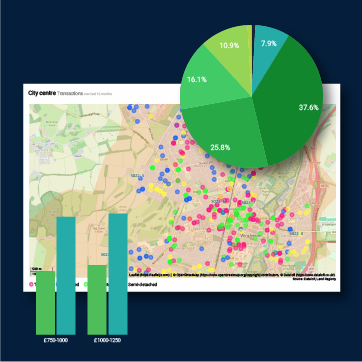
Enhanced mapping functionality allows users to select an area for analysis and quickly switch between already created areas. Users can create areas to analyse based on either postcode sectors, distance or a freely drawn area.
Find out how we can benefit your business: book a tour today.

Rory Black | Director, Dataloft
“We are now all visual learners, glancing at information, rather than consuming the detail. On Dataloft by PriceHubble we don’t just analyse sales and lettings data but interpret and present it in a way that wins new business. The
content is highly visual and creative.”