
Data releases have been delayed and restricted during the pandemic.
Millie Todd looked at the impact on key housing market indicators.
Covid-19 has taken an unprecedented toll on many things in the last few months, no less the different sources of data which commentators rely on to report on trends across the property market. This period will make it more challenging for many to report on accurate trends across the sector. There are some datasets which have temporarily been put on hold or may be reporting confusing or distorted results.
The analyst team at Dataloft continue to delve deeper into the information that is available, adding insight and interpretation and helping you to navigate through this uncertain time. There remains a wealth of information available to our subscribers across Dataloft Inform.
House price indices
Official UK House Price Index (ONS)
The Office for National Statistics announced that the UK House Price Index (HPI) was temporarily suspended in March. The impact of COVID-19 is expected to have greatly reduced the amount of housing transactions that took place in April, and ONS felt it would make it very difficult to produce a measure of UK house prices that would be representative. This means that we have been unable to update 2 charts on the Dataloft Inform National page, the National housing market trends chart and the Regional changes in average values in the last 12 months.
ONS announced that they will resume publication of the UK HPI on 19th August, they will begin by publishing the April 2020 index. They will publish interim releases with the view to resume normal publication in October of the August 2020 index. Therefore, we will be updating the National page over the next few months, back to the normal schedule in October.
There are other places on Dataloft Inform to get an understanding of house prices. The Nationwide, Halifax and Hometrack house price indices have all been released throughout Covid-19, these can be found on the National Summary page; UK Market Summary key housing market indices table.
It is worth bearing in mind, however, that those indices which are still reporting on house price changes, particularly those based on mortgage approvals or actual transactions, could be swayed by an unrepresentative sample of stock. Those sales which did complete during lockdown or soon after may have been more likely to be bought with cash, been a forced sale, empty property, new home or second home. These all occur in a usual market, but may have been more dominant during this time. We will know more on this in coming months.
We will add interpretation of the data available on the commentary in the House Price bullet points on the National Market page.
Nationwide HPI
Nationwide has continued to release its house price index, however, the April figures came with a warning that the pandemic is not fully captured in their index. The Nationwide index is constructed using mortgage approval data, and there is a lag between mortgage applications being submitted and approved. 80% of cases in the April sample relate to mortgage applications that commenced prior to the lockdown.
Nationwide claim that the May and June indices are a better reflection of what happened during lockdown. Nationwide state that their ability to generate the house price index has not been impacted to date, as sample sizes have remained sufficiently large to generate robust results. However, with only 9,273 mortgages approved in May, their sample size must be reduced.
We have continued to update Dataloft Inform with the Nationwide HPI; National Summary page; UK Market Summary Key housing market indices.

Halifax HPI
Halifax has continued to release its house price index, however, with a supporting note stating the house price indices are based on significantly lower volumes of mortgage transactions than average.
You can find these figures on the National Summary page; UK Market Summary Key housing market indices.

Rightmove HPI
Rightmove announced in April that, given lockdown and the pausing of key activities in the housing market, statistics on the number of properties coming to the market, new seller asking prices and new sales agreed are not meaningful, and therefore have not been published since March.
Therefore, on the National Summary page on Dataloft Inform, the Available properties per agent and the Average number of days to sell charts have not been updated since March 2020. There is still plenty of information on Dataloft Inform to help you understand demand in the housing market.
Have a look at the bullet points on the National Summary page as well as the Dataloft Demand Index, a great real-time indicator of housing market demand.
Mortgage Approvals – Bank of England
The Bank of England has continued to publish the number of mortgage approvals and the gross mortgage lending figures. Mortgage approvals and lending are a great indicator of demand in the housing market. However, gross mortgage lending does have a slight lag, therefore lending doesn’t always line up with mortgage approvals.
Mortgage approvals were down in April, and dropped even more in May, with just 9,273 approved. June figures show an improvement. Mortgage lending was also down in April, however, May figures improved slightly, albeit still lower than the quarterly and annual average. June lending increased slightly. Mortgage products are slowly returning to the market but lenders are prioritising existing customers and the back log of around 350,000 sales which did not complete during lockdown. There are very few high loan-to-value mortgage products currently available, this will affect first time buyers the most.


Nationwide and Halifax house price indices are produced using mortgage data. With uncertainty around employment and house prices, lenders are being more cautious. Therefore, valuations for mortgages may be under valuing, which may be seen in the Nationwide and Halifax house price indices.
Transaction data
Headline transactions
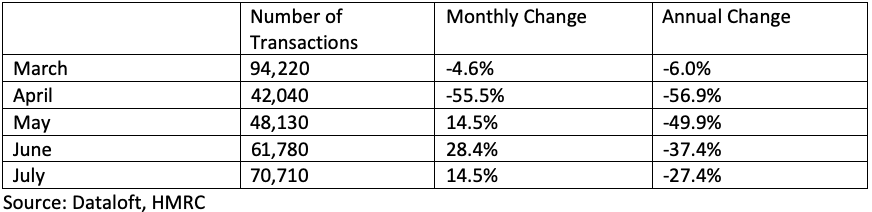
HMRC are still publishing UK residential property transactions which we show on the National Summary page; National housing market trends chart and UK Market Summary Key housing market indicators table. Therefore, you can continue to understand how residential transactions have been impacted by the pandemic and how they are recovering.
Land Registry transactions
Dataloft Inform uses Land Registry data in order to analyse transaction volumes at a local level. Land Registry has continued to publish its data throughout lockdown, however it is important to note that the data is not as representative as normal. Land Registry made the decision to publish it regardless, allowing them to maintain their commitment to transparency and open data.
The latest data published by Land Registry shows they are still running with a delay.

Therefore, on the Local Sales pages and Regional View page, you can still view the latest transactions volumes and sale prices. However, please note that from March onwards transactions may not be as representative as normal and are likely to be revised upward.
ONS Private Rents
ONS has continued to release its private rental index, this can be found on the National Summary page; Annual change in private rents. The rental index suggests a 1.4% annual increase in UK private rents in July. However, it can take time for supply and demand pressures to feed through to the ONS index, which mainly relies on rental renewals.
Dataloft Rental Market Analytics can provide a deep understanding of local rental markets, take a look at your lettings page or enquire if you do not currently subscribe to this. Dataloft has an exclusive rent paid dataset, key to understanding the rental market.